
Find MPAS boundary cells and simplify the domain polygon#
Find all boundary cells from
bdyMaskCellin the MPAS grid filePlot boundary cell shapes
Use
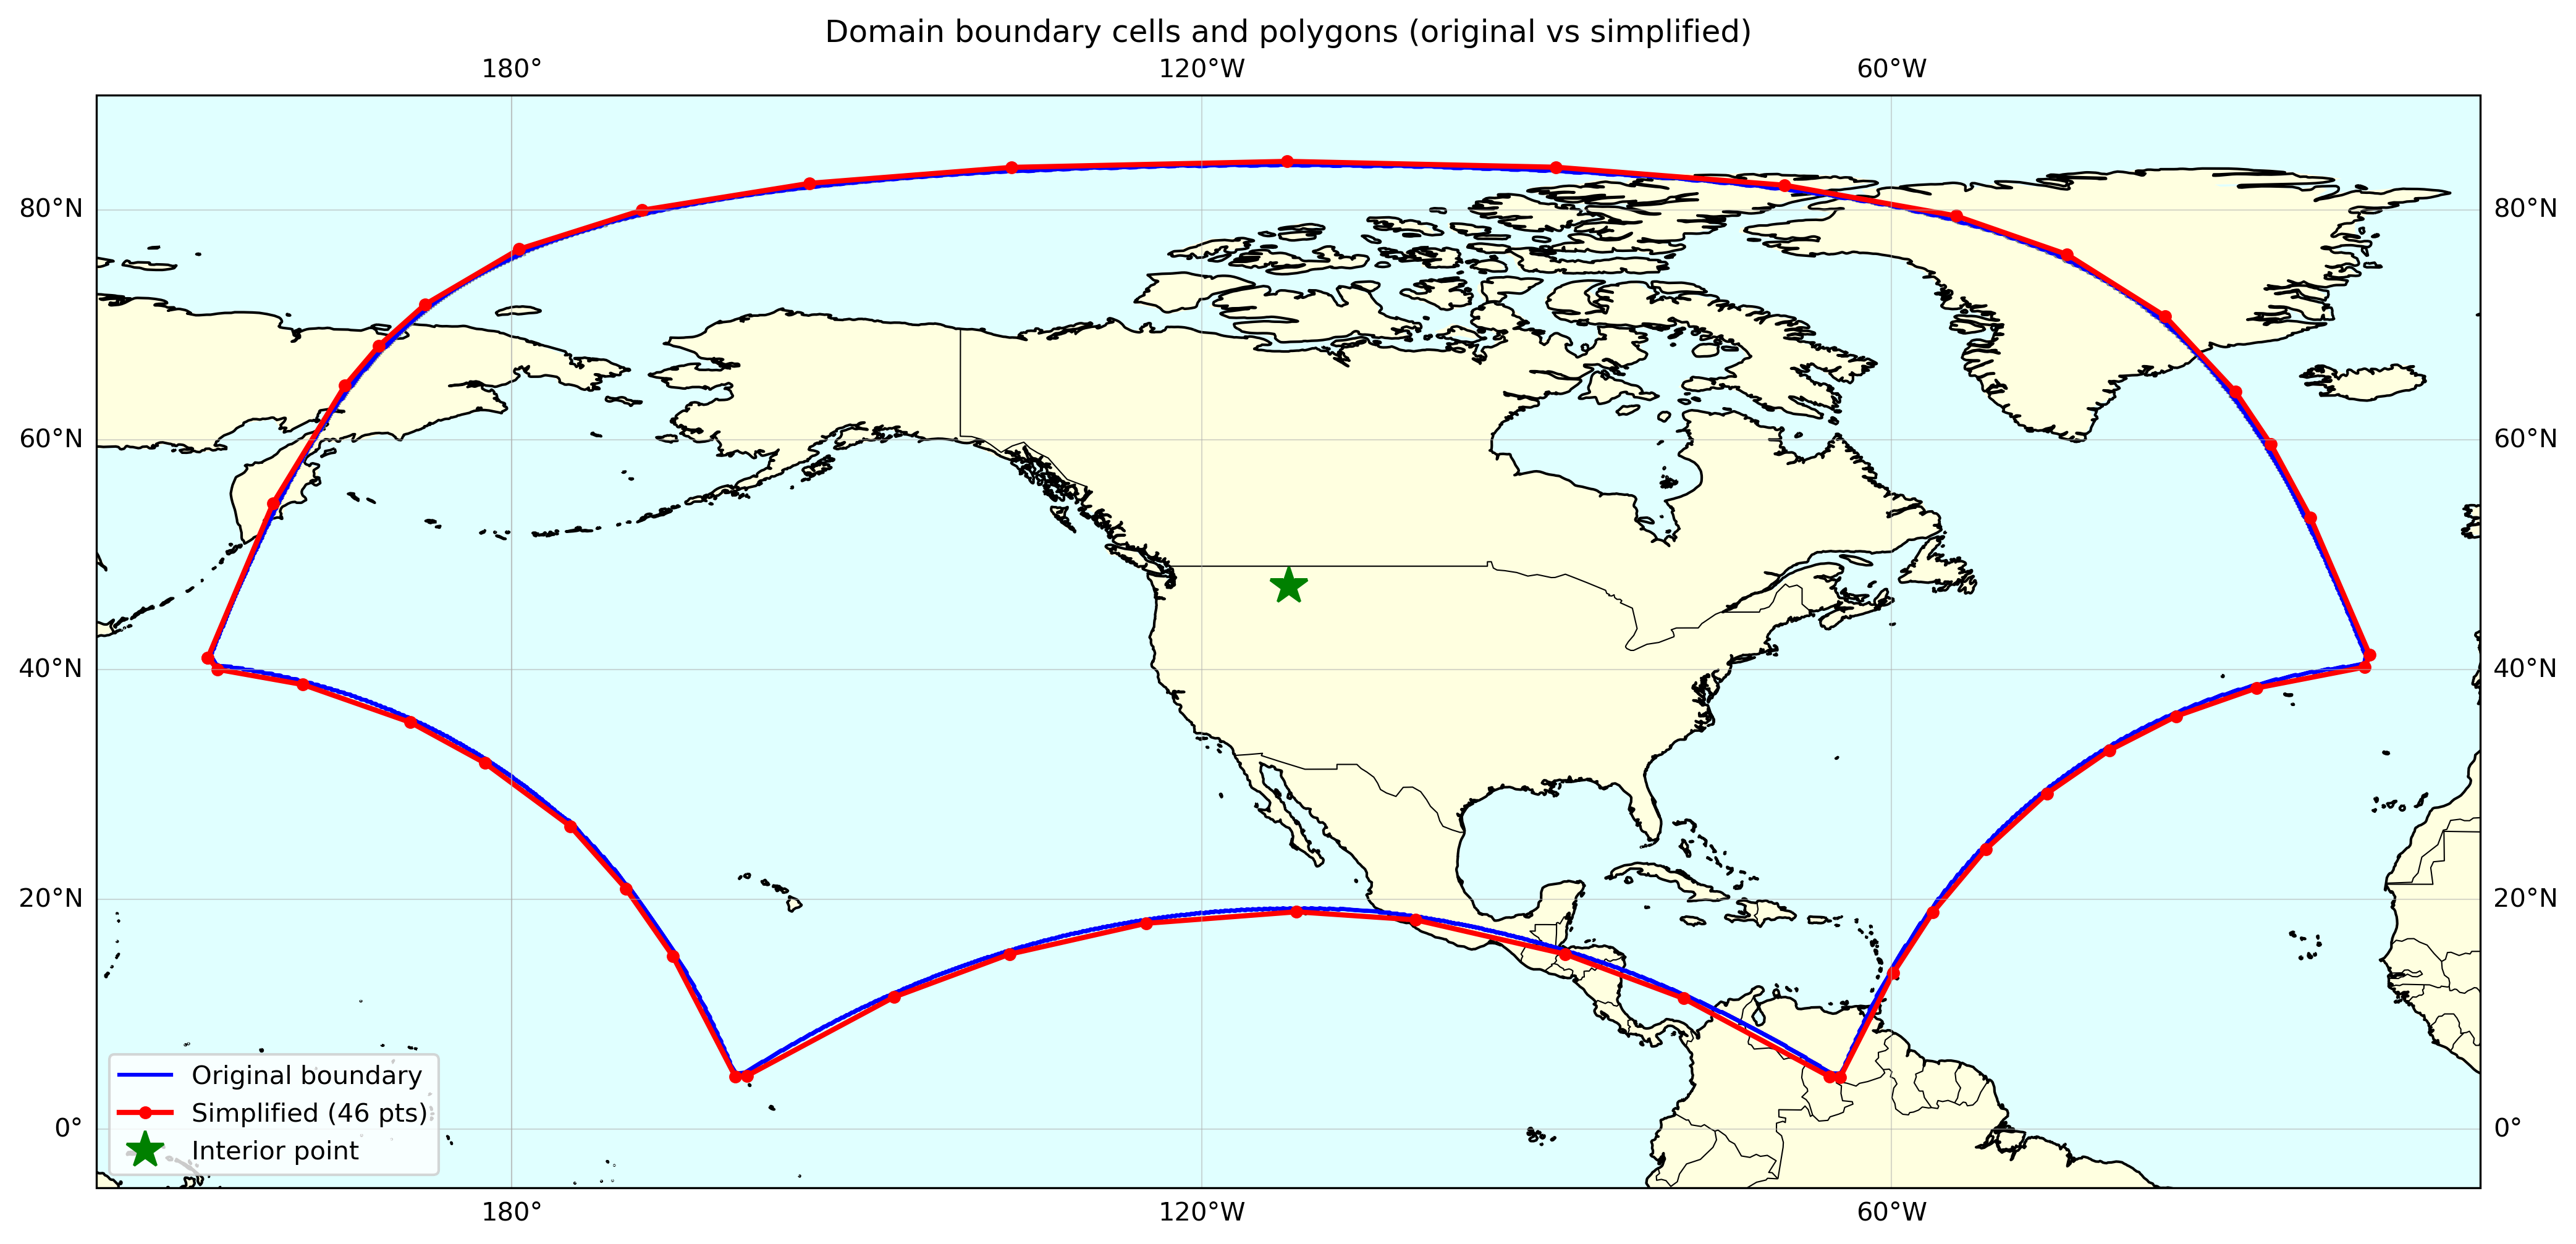
shapely.geometry.Polygon.simplifyto reduce thousands of boundary points to a few dozenVerify the simplified polygon covers the whole domain
0. get the pyDAmonitor_ROOT env variable#
This step is highly recommended. It is required if one want to use the DAmonitor Python package or use the MPAS/FV3 sample data or local cartopy nature_earth_data.
%%time
# autoload external python modules if they changed
%load_ext autoreload
%autoreload 2
import sys, os
pyDAmonitor_ROOT=os.getenv("pyDAmonitor_ROOT")
if pyDAmonitor_ROOT is None:
print("!!! pyDAmonitor_ROOT is NOT set. Run `source ush/load_pyDAmonitor.sh`")
else:
print(f"pyDAmonitor_ROOT={pyDAmonitor_ROOT}\n")
sys.path.insert(0, pyDAmonitor_ROOT)
pyDAmonitor_ROOT=/gpfs/f6/arfs-gsl/world-shared/gge/tmp/pyDAmonitor
CPU times: user 10.9 ms, sys: 19.3 ms, total: 30.1 ms
Wall time: 29.3 ms
0. import modules#
%%time
import numpy as np
from netCDF4 import Dataset
import matplotlib.pyplot as plt
import matplotlib as mpl
import cartopy
import cartopy.crs as ccrs
import cartopy.feature as cfeature
from shapely.geometry import Polygon, MultiPoint
from shapely import concave_hull
from DAmonitor.base import query_dataset
cartopy.config['data_dir'] = f"{pyDAmonitor_ROOT}/data/natural_earth_data"
CPU times: user 7.47 s, sys: 133 ms, total: 7.6 s
Wall time: 542 ms
1. read in the MPAS grid file and inspect bdyMaskCell, extract outermost boundary cells and their vertices#
%%time
mpas_domain = "na12km"
grid_file = os.path.join(pyDAmonitor_ROOT, f'data/mpasjedi/{mpas_domain}.grid.nc')
ds = Dataset(grid_file, 'r')
bdyMaskCell = ds.variables['bdyMaskCell'][:]
print(f"bdyMaskCell unique values: {np.unique(bdyMaskCell)}")
print(f" 0 (interior): {np.sum(bdyMaskCell == 0)} cells")
for v in range(1, bdyMaskCell.max() + 1):
print(f" {v} (boundary layer {v}): {np.sum(bdyMaskCell == v)} cells")
# ~~~~~~~~~~~~~~~~~~~~~~~~~~~~~~~~~~~~~~~~~~~~~~~~~~~~~~~~~~~~~~~~~~~~~~~~~~~~~~~~~~~~
# outermost boundary: maximum value of bdyMaskCell
bdy_max = bdyMaskCell.max()
# cell center coordinates (convert radians to degrees)
lonCell = np.degrees(ds.variables['lonCell'][:])
latCell = np.degrees(ds.variables['latCell'][:])
# vertex coordinates
lonVertex = np.degrees(ds.variables['lonVertex'][:])
latVertex = np.degrees(ds.variables['latVertex'][:])
# connectivity
verticesOnCell = ds.variables['verticesOnCell'][:] # (nCells, maxEdges), 1-based
nEdgesOnCell = ds.variables['nEdgesOnCell'][:]
# all boundary cells (bdyMaskCell >= 1) and per-layer masks
mask_all_bdy = bdyMaskCell >= 1
bdy_layers = {}
for layer in range(1, bdy_max + 1):
bdy_layers[layer] = bdyMaskCell == layer
# outermost boundary cell data (for polygon construction)
mask_outer = bdyMaskCell == bdy_max
lat_bdy = latCell[mask_outer]
lon_bdy = lonCell[mask_outer]
verts_bdy = verticesOnCell[mask_outer]
nEdges_bdy = nEdgesOnCell[mask_outer]
print(f"Total boundary cells (all {bdy_max} layers): {mask_all_bdy.sum()}")
print(f"Outermost boundary cells (layer {bdy_max}): {mask_outer.sum()}")
print(f"Lat range: {lat_bdy.min():.2f} to {lat_bdy.max():.2f}")
print(f"Lon range: {lon_bdy.min():.2f} to {lon_bdy.max():.2f}")
bdyMaskCell unique values: [0 1 2 3 4 5 6 7]
0 (interior): 608665 cells
1 (boundary layer 1): 3211 cells
2 (boundary layer 2): 3216 cells
3 (boundary layer 3): 3221 cells
4 (boundary layer 4): 3226 cells
5 (boundary layer 5): 3231 cells
6 (boundary layer 6): 3236 cells
7 (boundary layer 7): 3241 cells
Total boundary cells (all 7 layers): 22582
Outermost boundary cells (layer 7): 3241
Lat range: 4.91 to 83.87
Lon range: 153.86 to 341.19
CPU times: user 27.9 ms, sys: 36.1 ms, total: 64.1 ms
Wall time: 244 ms
2. build polygon by walking MPAS boundary edges and simplify#
Walk the actual boundary edges of the MPAS mesh to construct the exact domain polygon.
Boundary edges are those where one of cellsOnEdge is 0 (missing neighbor).
%%time
from collections import defaultdict
# read edge connectivity
cellsOnEdge = np.asarray(ds.variables['cellsOnEdge'][:]) # (nEdges, 2), 1-based
verticesOnEdge = np.asarray(ds.variables['verticesOnEdge'][:]) # (nEdges, 2), 1-based
# boundary edges: one of the two cells is 0 (missing neighbor)
boundary_mask = (cellsOnEdge[:, 0] == 0) | (cellsOnEdge[:, 1] == 0)
print(f"Total edges: {cellsOnEdge.shape[0]}, boundary edges: {boundary_mask.sum()}")
# get vertex indices (0-based) for boundary edges
bedge_verts = verticesOnEdge[boundary_mask] - 1
v1, v2 = bedge_verts[:, 0], bedge_verts[:, 1]
# build adjacency graph along boundary edges
adj = defaultdict(list)
for a, b in zip(v1, v2):
adj[a].append(b)
adj[b].append(a)
# walk the boundary to form a closed ring
visited_edges = set()
loops = []
for start in list(adj.keys()):
for nb in adj[start]:
edge_key = (min(start, nb), max(start, nb))
if edge_key in visited_edges:
continue
ring = [start, nb]
visited_edges.add(edge_key)
prev, cur = start, nb
while True:
neighbors = adj[cur]
nxt = neighbors[0] if neighbors[0] != prev else (neighbors[1] if len(neighbors) > 1 else None)
if nxt is None:
break
ek = (min(cur, nxt), max(cur, nxt))
if ek in visited_edges:
if nxt == ring[0]:
loops.append(ring)
break
visited_edges.add(ek)
ring.append(nxt)
prev, cur = cur, nxt
if cur == ring[0]:
loops.append(ring)
break
print(f"Found {len(loops)} boundary loop(s), sizes: {[len(l) for l in loops]}")
ring_ids = max(loops, key=len)
print(f"Using largest loop with {len(ring_ids)} vertices")
# build the exact boundary polygon from the walked ring
ring_lons = lonVertex[ring_ids]
ring_lats = latVertex[ring_ids]
domain_polygon = Polygon(zip(ring_lons, ring_lats))
if not domain_polygon.is_valid:
print(f"WARNING: polygon is invalid, fixing with buffer(0)...")
domain_polygon = domain_polygon.buffer(0)
print(f"Edge-walk polygon type: {domain_polygon.geom_type}, valid: {domain_polygon.is_valid}")
print(f"Number of boundary points (before simplify): {len(domain_polygon.exterior.coords)}")
# ~~~~~~~~~~~~~~~~~~~~~~~~~~~~~~~~~~~~~~~~~~~~~~~~~~~~~~~~~~~~~~~~~~~~~~~~~~~~~~~~~~~~
# collect all unique vertices of outermost boundary cells (for coverage check)
from shapely.geometry import Point
from shapely.prepared import prep
vertex_ids = set()
for i in range(mask_outer.sum()):
nEdges = nEdges_bdy[i]
for j in range(nEdges):
vertex_ids.add(verts_bdy[i, j] - 1)
vertex_ids = np.array(sorted(vertex_ids))
bdy_vlons = lonVertex[vertex_ids]
bdy_vlats = latVertex[vertex_ids]
print(f"Unique vertices on outermost boundary cells: {len(vertex_ids)}")
def check_coverage(poly, lons, lats):
"""Return count of points contained in poly (including boundary)."""
p = prep(poly)
inside = sum(1 for lon, lat in zip(lons, lats) if p.contains(Point(lon, lat)) or poly.boundary.distance(Point(lon, lat)) < 1e-10)
return inside, len(lons)
# ~~~~~~~~~~~~~~~~~~~~~~~~~~~~~~~~~~~~~~~~~~~~~~~~~~~~~~~~~~~~~~~~~~~~~~~~~~~~~~~~~~~~
# auto-tune buffer_deg, tolerance and simplify the number of points to below MAX_POINTS
MAX_POINTS = 60
TOLERANCE_START = 0.30 # degrees, for Douglas-Peucker simplification
BUFFER_DEG_START = TOLERANCE_START
found = False
for buffer_deg in np.arange(BUFFER_DEG_START, 2.05, 0.05):
for tolerance in np.arange(TOLERANCE_START, 0.6, 0.10):
buffered = domain_polygon.buffer(buffer_deg)
simplified_candidate = buffered.simplify(tolerance, preserve_topology=True)
npts = len(simplified_candidate.exterior.coords)
inside, total = check_coverage(simplified_candidate, bdy_vlons, bdy_vlats)
pct = inside / total * 100
print(f" buffer={buffer_deg:.2f}, tol={tolerance:.2f} => {npts} pts, "
f"coverage={inside}/{total} ({pct:.1f}%)")
if inside == total and npts <= MAX_POINTS:
print(f"\n *** 100% coverage with {npts} pts (<= {MAX_POINTS}) at "
f"buffer_deg={buffer_deg:.2f}, tolerance={tolerance:.2f} ***")
found = True
break
if found:
break
else:
print(f"\n WARNING: target not reached (100% coverage with <= {MAX_POINTS} pts)")
# store the final result
domain_polygon_buffered = domain_polygon.buffer(buffer_deg)
simplified = domain_polygon_buffered.simplify(tolerance, preserve_topology=True)
print(f"\nFinal simplified polygon (edge-walk): {len(simplified.exterior.coords)} points "
f"(tol={tolerance:.2f}, buffer={buffer_deg:.2f})")
Total edges: 1896984, boundary edges: 6487
Found 1 boundary loop(s), sizes: [6488]
Using largest loop with 6488 vertices
Edge-walk polygon type: Polygon, valid: True
Number of boundary points (before simplify): 6488
Unique vertices on outermost boundary cells: 12964
buffer=0.30, tol=0.30 => 46 pts, coverage=12964/12964 (100.0%)
*** 100% coverage with 46 pts (<= 60) at buffer_deg=0.30, tolerance=0.30 ***
Final simplified polygon (edge-walk): 46 points (tol=0.30, buffer=0.30)
CPU times: user 301 ms, sys: 16.3 ms, total: 318 ms
Wall time: 401 ms
3. plot original and simplified polygon as well as outermost cells (interactive)#
import plotly.graph_objects as go
import plotly.io as pio
pio.renderers.default = 'notebook' # this is critical to render the plotly plots on the rendered webpages!!
fig = go.Figure()
# outermost boundary cell polygons (single trace with None separators)
all_lats = []
all_lons = []
for i in range(lat_bdy.size):
nEdges = nEdges_bdy[i]
verts = verts_bdy[i, :nEdges] - 1
poly_lon = list(lonVertex[verts]) + [lonVertex[verts[0]]]
poly_lat = list(latVertex[verts]) + [latVertex[verts[0]]]
all_lats.extend(poly_lat + [None])
all_lons.extend(poly_lon + [None])
fig.add_trace(go.Scattermap(
lat=all_lats, lon=all_lons,
mode='lines',
line=dict(width=1, color='gray'),
name='Boundary cells',
hoverinfo='skip',
))
# original concave hull
ox, oy = domain_polygon.exterior.xy
fig.add_trace(go.Scattermap(
lat=list(oy), lon=list(ox),
mode='lines',
line=dict(width=2, color='blue'),
name='Original boundary',
))
# simplified polygon
sx, sy = simplified.exterior.xy
fig.add_trace(go.Scattermap(
lat=list(sy), lon=list(sx),
mode='lines+markers',
line=dict(width=3, color='red'),
marker=dict(size=7, color='red'),
name=f'Simplified ({len(simplified.exterior.coords)} pts)',
))
# plot interior point
interior_pt = simplified.representative_point()
fig.add_trace(go.Scattermap(
lat=[interior_pt.y], lon=[interior_pt.x],
mode='markers',
marker=dict(size=14, color='green', symbol='cross'),
name='Interior point',
))
fig.update_layout(
width=1600,
height=1200,
margin=dict(l=0, r=0, t=40, b=0),
title='Domain boundary cells and polygons (original vs simplified)',
map_style='open-street-map',
map_center=dict(lat=float(np.mean(lat_bdy)), lon=float(np.mean(lon_bdy))),
map_zoom=3,
)
fig.show()
4. (optional) plot original and simplified polygon (static, PlateCarree)#
For the very large north american domains, the shape looks differently in a static PlateCarree plot.
fig, ax = plt.subplots(figsize=(14, 10), dpi=300, subplot_kw={'projection': ccrs.PlateCarree(central_longitude=240)})
# add map features
ax.coastlines(resolution='50m')
ax.add_feature(cfeature.BORDERS, linewidth=0.5)
# ax.add_feature(cfeature.STATES, linewidth=0.3, edgecolor='gray')
ax.add_feature(cfeature.LAND, facecolor='lightyellow')
ax.add_feature(cfeature.OCEAN, facecolor='lightcyan')
# plot outermost boundary cell polygons
for i in range(lat_bdy.size):
nEdges = nEdges_bdy[i]
verts = verts_bdy[i, :nEdges] - 1
poly_lon = list(lonVertex[verts]) + [lonVertex[verts[0]]]
poly_lat = list(latVertex[verts]) + [latVertex[verts[0]]]
ax.plot(poly_lon, poly_lat, color='gray', linewidth=0.3, transform=ccrs.PlateCarree())
# original concave hull
ox, oy = domain_polygon.exterior.xy
ax.plot(list(ox), list(oy), color='blue', linewidth=1.5, label='Original boundary', transform=ccrs.PlateCarree())
# simplified polygon
sx, sy = simplified.exterior.xy
ax.plot(list(sx), list(sy), color='red', linewidth=2, marker='o', markersize=4,
label=f'Simplified ({len(simplified.exterior.coords)} pts)', transform=ccrs.PlateCarree())
# interior point
interior_pt = simplified.representative_point()
ax.plot(interior_pt.x, interior_pt.y, marker='*', color='green', markersize=15, linestyle='None',
label='Interior point', transform=ccrs.PlateCarree())
# set extent with some padding
pad = 10
ax.set_extent([lon_bdy.min() - pad, lon_bdy.max() + pad,
lat_bdy.min() - pad, lat_bdy.max() + pad], crs=ccrs.PlateCarree())
ax.set_title('Domain boundary cells and polygons (original vs simplified)')
ax.legend(loc='lower left')
ax.gridlines(draw_labels=True, linewidth=0.5, alpha=0.5)
plt.tight_layout()
plt.show()
5. output simplified polygon for use in config files#
# find an interior point near the center of the polygon
# representative_point() is guaranteed to be inside the polygon
interior_pt = simplified.representative_point()
inside_lon = interior_pt.x
inside_lat = interior_pt.y
# extract vertex coordinates
coords = list(simplified.exterior.coords)
vlons = [round(x, 2) for x, y in coords]
vlats = [round(y, 2) for x, y in coords]
# verify that the polygon from rounded vlons/vlats still covers all boundary cells
rounded_poly = Polygon(zip(vlons, vlats))
inside_r, total_r = check_coverage(rounded_poly, bdy_vlons, bdy_vlats)
pct_r = inside_r / total_r * 100
print(f"Rounded polygon coverage: {inside_r}/{total_r} ({pct_r:.1f}%)")
if inside_r < total_r:
print(f"WARNING: {total_r - inside_r} boundary vertices are outside the rounded polygon!")
print("Consider increasing buffer_deg or rounding precision.")
else:
print("All boundary cell vertices are inside the rounded polygon!")
# write to file and print
outfile = f'{mpas_domain}.polygon.yaml'
with open(outfile, 'w') as f:
f.write(f'''_polygon: &polygonConfig
# {mpas_domain} polygon.simplify: buffer_deg={buffer_deg:.2f}, tolerance={tolerance:.2f}, {len(coords)} vertices
inside point longitude: {inside_lon:.2f}
inside point latitude: {inside_lat:.2f}
''')
if len(vlons) > 25:
mid = (len(vlons) - 2) // 2 # second line gets equal or more elements
lons_str1 = str(vlons[:mid])[:-1] # remove trailing ]
lons_str2 = str(vlons[mid:])[1:] # remove leading [
lats_str1 = str(vlats[:mid])[:-1]
lats_str2 = str(vlats[mid:])[1:]
f.write(f" vertex longitudes: {lons_str1},\n")
f.write(f" {lons_str2}\n")
f.write(f" vertex latitudes: {lats_str1},\n")
f.write(f" {lats_str2}\n")
else:
f.write(f" vertex longitudes: {vlons}\n")
f.write(f" vertex latitudes: {vlats}\n")
f.write(f" action:\n name: reduce obs space\n\n")
print(f"\nConfiguration has been written to: {outfile}")
print(f"Here is the file content:\n")
with open(outfile, 'r') as f:
print(f.read())
Rounded polygon coverage: 12964/12964 (100.0%)
All boundary cell vertices are inside the rounded polygon!
Configuration has been written to: na12km.polygon.yaml
Here is the file content:
_polygon: &polygonConfig
# na12km polygon.simplify: buffer_deg=0.30, tolerance=0.30, 46 vertices
inside point longitude: 247.59
inside point latitude: 47.27
vertex longitudes: [153.56, 159.23, 165.49, 168.43, 172.47, 180.63, 191.32, 205.9, 223.46, 247.43, 270.8, 290.69, 305.6, 315.25, 323.77, 329.88, 332.97, 336.41, 341.57, 341.16, 331.75, 324.73,
318.94, 313.49, 308.21, 303.56, 300.13, 295.53, 294.6, 281.91, 271.59, 258.59, 248.25, 235.18, 223.3, 213.23, 200.44, 199.45, 193.99, 189.91, 185.08, 177.64, 171.18, 161.83, 154.42, 153.56]
vertex latitudes: [41.04, 54.47, 64.72, 68.18, 71.78, 76.58, 79.97, 82.31, 83.7, 84.22, 83.71, 82.15, 79.48, 76.12, 70.75, 64.2, 59.61, 53.25, 41.28, 40.23, 38.4, 35.95,
32.98, 29.23, 24.4, 18.86, 13.6, 4.55, 4.59, 11.4, 15.26, 18.23, 18.93, 17.93, 15.25, 11.51, 4.66, 4.57, 15.09, 20.95, 26.38, 31.88, 35.42, 38.7, 40.02, 41.04]
action:
name: reduce obs space
—————— The End of this notebook ——————
S1: build a polygon from boundary cell vertices using concave_hull and simplify#
We may use concave_hull to generate the first version of domain polygon as well.
So far the polygons generated by this method has larger gaps than those from the “walking edges” method in the above.
Hence we no longer use this method but save the code block for the archiving purpose.
Use outer vertices (not cell centers) so the polygon covers entire cells. Then simplify to reduce to a few dozen vertices.
if 1 == 2: # change to 1 == 1 to run the following code
from shapely.geometry import Point
from shapely.prepared import prep
# collect all unique vertices of outermost boundary cells
# these vertices are at the cell edges, extending beyond cell centers
vertex_ids = set()
for i in range(mask_outer.sum()):
nEdges = nEdges_bdy[i]
for j in range(nEdges):
vertex_ids.add(verts_bdy[i, j] - 1) # convert 1-based to 0-based
vertex_ids = np.array(sorted(vertex_ids))
bdy_vlons = lonVertex[vertex_ids]
bdy_vlats = latVertex[vertex_ids]
print(f"Unique vertices on outermost boundary cells: {len(vertex_ids)}")
# create a concave hull from boundary cell vertices
points = MultiPoint(list(zip(bdy_vlons, bdy_vlats)))
concave_ratio = 0.3 # smaller = tighter fit to concave shapes
domain_polygon = concave_hull(points, ratio=concave_ratio)
print(f"Domain polygon type: {domain_polygon.geom_type}")
print(f"Number of boundary points (before simplify): {len(domain_polygon.exterior.coords)}")
# ~~~~~~~~~~~~~~~~~~~~~~~~~~~~~~~~~~~~~~~~~~~~~~~~~~~~~~~~~~~~~~~~~~~~~~~~~~~~~~~~~~~~
# auto-tune buffer_deg: increase until 100% of boundary cell vertices are inside
tolerance = 0.05 # degrees; the larger the fewer points
def check_coverage(poly, lons, lats):
"""Return count of points contained in poly."""
p = prep(poly)
inside = sum(1 for lon, lat in zip(lons, lats) if p.contains(Point(lon, lat)))
return inside, len(lons)
buffer_deg = 0.05
while buffer_deg <= 2.0:
buffered = domain_polygon.buffer(buffer_deg)
simplified_candidate = buffered.simplify(tolerance, preserve_topology=True)
inside, total = check_coverage(simplified_candidate, bdy_vlons, bdy_vlats)
pct = inside / total * 100
print(f" buffer_deg={buffer_deg:.2f} => {len(simplified_candidate.exterior.coords)} pts, "
f"coverage={inside}/{total} ({pct:.1f}%)")
if inside == total:
print(f"\n *** 100% coverage achieved with buffer_deg={buffer_deg:.2f} ***")
break
buffer_deg += 0.05
else:
print(f"\n WARNING: 100% coverage not reached at buffer_deg={buffer_deg:.2f}")
# store the final result
domain_polygon_buffered = domain_polygon.buffer(buffer_deg)
simplified = domain_polygon_buffered.simplify(tolerance, preserve_topology=True)
print(f"\nFinal simplified polygon: {len(simplified.exterior.coords)} points (tol={tolerance}, buffer={buffer_deg:.2f})")