run a script in a notebook to plot analysis increment profile and vertical cross section#
Run scripts/vertical_profile_mpasjedi.py developed by Junjun Hu
Preparation, adding pyDAmonitor_ROOT to sys.path; load modules#
%%time

# autoload external python modules if they changed
%load_ext autoreload
%autoreload 2

import sys, os
pyDAmonitor_ROOT=os.getenv("pyDAmonitor_ROOT")
if pyDAmonitor_ROOT is None:
    print("!!! pyDAmonitor_ROOT is NOT set. Run `source ush/load_pyDAmonitor.sh`")
else:
    print(f"pyDAmonitor_ROOT={pyDAmonitor_ROOT}\n")
sys.path.insert(0, pyDAmonitor_ROOT)

from DAmonitor.base import load_figs
pyDAmonitor_ROOT=/ncrc/home2/Guoqing.Ge/pyDAmonitor
CPU times: user 7.23 s, sys: 137 ms, total: 7.37 s
Wall time: 310 ms
Run the vertical_profile_mpasjedi.py script directly in the Notebook#
%%time
%run {pyDAmonitor_ROOT}/scripts/vertical_profile_mpasjedi.py
CPU times: user 3.59 s, sys: 2.55 s, total: 6.14 s
Wall time: 6.36 s
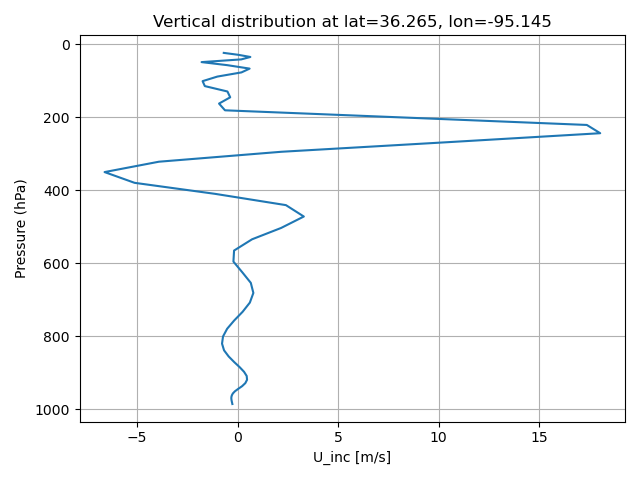
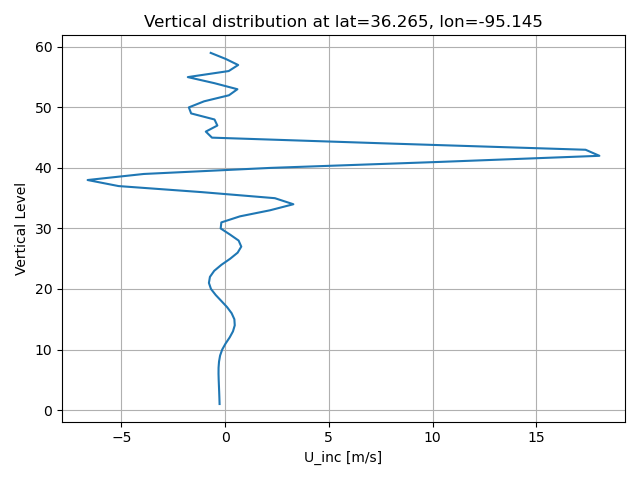
load the generate figures (vertical profiles and vertical cross sections)#
load_figs('./U_inc_p.png', 'U_inc_z.png') #, 'U_inc_xp.png', 'U_inc_xz.png', 'U_inc_yp.png', 'U_inc_yp.png', 'U_inc_yz.png' )
cat the content of scripts/vertical_profile_mpasjedi.py#
!cat $pyDAmonitor_ROOT/scripts/vertical_profile_mpasjedi.py
#!/usr/bin/env python
import warnings
import os
from netCDF4 import Dataset
import numpy as np
import matplotlib.pyplot as plt
# import xarray as xr
import colormap
import matplotlib
matplotlib.use('agg')
warnings.filterwarnings('ignore')
pyDAmonitor_ROOT = os.getenv("pyDAmonitor_ROOT")


def plot_inc(var_inc, decimal=3):
    max_inc = np.around(np.max(var_inc), decimal)
    min_inc = np.around(np.min(var_inc), decimal)
    # decide the color contours based on the increment values
    clevmax = max((abs(max_inc), abs(min_inc)))
    inc = 0.05 * clevmax
    clevs = np.arange(-1.0 * clevmax, 1.0 * clevmax + inc, inc)
    cm = colormap.diff_colormap(clevs)
    return clevs, cm

# plot cross section


def cross_section(latlon, levs, var, clevs, cm, title, xlab, ylab, cblab, invert_y=0):
    fig = plt.figure(figsize=(8, 8))
    ct = plt.contourf(latlon, levs, var, clevs, cmap=cm, extend='both')
    plt.xlabel(xlab, size=14)
    plt.ylabel(ylab, size=14)
    plt.title(title)
    if (invert_y == 1):
        plt.gca().invert_yaxis()  # optional, depending on your z direction

    # Add colorbar
    cbar = fig.colorbar(ct, orientation="horizontal", fraction=0.046, pad=0.1)
    cbar.set_label(cblab, size=14)
    cbar.ax.tick_params(labelsize=10, rotation=30)
    plt.grid(True)
    plt.tight_layout()
    # plt.show()


def get_Index(axis, target, lats, lons, tolerance=0.2):
    if (axis == 'latitude'):
        value = target  # the constant lat value
        mask = np.abs(lats - value) < tolerance
        sort_idx = np.argsort(lons[mask])
        # coord = lons[mask][sort_idx]
    else:
        value = target  # the constant lon value
        mask = np.abs(lons - value) < tolerance
        sort_idx = np.argsort(lats[mask])
        # coord = lats[mask][sort_idx]

    return mask, sort_idx


def main():
    # janalysis = "/scratch1/BMC/wrfruc/jjhu/rundir/wrkflow-test/Btuning/2024050601_lbc/uv233/singleob_rh4rv0_avgheight_std14/mpasin.nc"
    # jbackgrnd = "/scratch1/BMC/wrfruc/jjhu/rundir/wrkflow-test/Btuning/2024050601_tuneB/bkg/mpasout.2024-05-06_01.00.00.nc"
    # jstatic = "/scratch1/BMC/wrfruc/jjhu/rundir/wrkflow-test/Btuning/2024050601_tuneB/invariant.nc"

    janalysis = f"{pyDAmonitor_ROOT}/data/mpasjedi/ana.nc"
    jbackgrnd = f"{pyDAmonitor_ROOT}/data/mpasjedi/bkg.nc"
    jstatic = f"{pyDAmonitor_ROOT}/data/mpasjedi/invariant.nc"

    figdir = "./"

    # varible to plot
    variable = "U"

    target_lat, target_lon = 36.265, -95.145

    # Open NETCDF4 dataset for reading
    nc_a = Dataset(janalysis, mode='r')
    nc_b = Dataset(jbackgrnd, mode='r')
    f_latlon = Dataset(jstatic, "r")

    # read lat,lon information
    lats = np.array(f_latlon.variables['latCell'][:]) * 180.0 / np.pi  # Latitude of cells, rad
    lons0 = np.array(f_latlon.variables['lonCell'][:]) * 180.0 / np.pi  # Longitude of cells, rad
    lons = np.where(lons0 > 180.0, lons0 - 360.0, lons0)
    # z = f_latlon.variables['zgrid'][:]  # Geometric height of layer interfaces, m MSL

    # Grab variables
    if variable == "T":  # Convert to temperature
        unit = "K"
        jedi_a = nc_a.variables["theta"][0, :, :].astype(np.float64)  # (Time, nCells, nVertLevels)
        jedi_b = nc_b.variables["theta"][0, :, :].astype(np.float64)
        pres_a = (nc_a.variables['pressure_p'][0, :, :] + nc_b['pressure_base'][0, :, :])/100.0
        pres_b = (nc_b.variables['pressure_p'][0, :, :] + nc_b['pressure_base'][0, :, :])/100.0
        dividend_a = (1000.0/pres_a)**(0.286)
        dividend_b = (1000.0/pres_b)**(0.286)
        jedi_a = jedi_a / dividend_a
        jedi_b = jedi_b / dividend_b

    if variable == "Q":
        unit = "mg/kg"
        jedi_a = nc_a.variables['qv'][0, :, :] * 1000000.0
        jedi_b = nc_b.variables['qv'][0, :, :] * 1000000.0

    if variable == "U":
        unit = "m/s"
        jedi_a = nc_a.variables['uReconstructZonal'][0, :, :]
        jedi_b = nc_b.variables['uReconstructZonal'][0, :, :]
    if variable == "V":
        unit = "m/s"
        jedi_a = nc_a.variables['uReconstructMeridional'][0, :, :]
        jedi_b = nc_b.variables['uReconstructMeridional'][0, :, :]

    pres_b = (nc_b.variables['pressure_p'][0, :, :] + nc_b['pressure_base'][0, :, :])/100.0  # pressure profile
    vlevs = np.arange(1, jedi_a.shape[1]+1)  # model vertical levels
    jedi_inc = jedi_a - jedi_b  # the increment

    # ------------------- the vertical profile begin -----------------
    # The nearest grid cell to the desired lat/lon
    dist = np.sqrt((lats - target_lat)**2 + (lons - target_lon)**2)
    idx = np.argmin(dist)

    # get 1-d vertical profile at the target lat/lon
    jedi_inc_z = jedi_inc[idx, :]
    pres_z = pres_b[idx, :]

    # plot against pressures
    plt.plot(jedi_inc_z, pres_z)
    xlab = f"{variable}_inc [{unit}]"
    plt.xlabel(xlab)
    plt.ylabel("Pressure (hPa)")
    plt.title(f"Vertical distribution at lat={target_lat}, lon={target_lon}")
    plt.gca().invert_yaxis()  # optional, depending on your z direction
    plt.grid()
    plt.tight_layout()
    plt.savefig(f'{figdir}/{variable}_inc_p.png')
    plt.close()

    # plot against model leves
    plt.plot(jedi_inc_z, vlevs)
    plt.xlabel(xlab)
    plt.ylabel("Vertical Level")
    plt.title(f"Vertical distribution at lat={target_lat}, lon={target_lon}")
    plt.grid()
    plt.tight_layout()
    plt.savefig(f'{figdir}/{variable}_inc_z.png')
    plt.close()
    # ------------------- the vertical profile end -----------------

    # ------------------ longitude-pressure(/levels) cross section begin -----------------
    # transpose
    jedi_inc_T = jedi_inc.T
    pres_T = pres_b.T  # pressure levels

    clevs, cm = plot_inc(jedi_inc)

    axis = 'latitude'
    mask1, sort_idx1 = get_Index(axis, target_lat, lats, lons)
    latlon = lons[mask1][sort_idx1]

    jedi_inc_xz = jedi_inc_T[:, mask1][:, sort_idx1]  # shape: (nLevels, nCrossPoints)
    pres_xz = pres_T[:, mask1][:, sort_idx1]          # height (same shape)

    title = f"X-Z Cross section of {variable}_inc [{unit}]  at lat={target_lat}"
    xlab = "Longitudes"
    cblab = f"{variable}_inc [{unit}]"
    vaxis = vlevs  # against vertical levels
    ylab = "Vertical Level"
    cross_section(latlon, vaxis, jedi_inc_xz, clevs, cm, title, xlab, ylab, cblab, 0)
    plt.tight_layout()
    plt.savefig(f'{figdir}/{variable}_inc_xz.png')
    plt.close()

    ylab = "Pressure (hPa)"
    vaxis = pres_xz.mean(axis=1)
    cross_section(latlon, vaxis, jedi_inc_xz, clevs, cm, title, xlab, ylab, cblab, 1)
    plt.tight_layout()
    plt.savefig(f'{figdir}/{variable}_inc_xp.png')
    plt.close()
    # ------------------ longitude-pressure(/levels) cross section end -----------------

    # ------------------ latitude-pressure(/levels) cross section begin -----------------
    # make latitude-pressure(/levels) cross section
    axis = 'longitude'
    mask2, sort_idx2 = get_Index(axis, target_lon, lats, lons)

    jedi_inc_yz = jedi_inc_T[:, mask2][:, sort_idx2]      # shape: (nLevels, nCrossPoints)
    pres_yz = pres_T[:, mask2][:, sort_idx2]          # height (same shape)
    latlon = lats[mask2][sort_idx2]

    title = f"Y-Z Cross section of {variable}_inc [{unit}]  at lat={target_lat}"
    xlab = "Latitudes"
    cblab = f"{variable}_inc [{unit}]"
    vaxis = vlevs  # against vertical levels
    ylab = "Vertical Level"
    cross_section(latlon, vaxis, jedi_inc_yz, clevs, cm, title, xlab, ylab, cblab, 0)
    plt.tight_layout()
    plt.savefig(f'{figdir}/{variable}_inc_yz.png')
    plt.close()

    ylab = "Pressure (hPa)"
    vaxis = pres_yz.mean(axis=1)
    cross_section(latlon, vaxis, jedi_inc_yz, clevs, cm, title, xlab, ylab, cblab, 1)
    plt.tight_layout()
    plt.savefig(f'{figdir}/{variable}_inc_yp.png')
    plt.close()
    # ------------------ latitude-pressure(/levels) cross section end -----------------


if __name__ == '__main__':
    main()